The ability of a pile group to resist lateral loads is a significant design issue. The deflection of a pile group under a lateral load is typically 2 to 3 times larger than the deflection of a single pile loaded to the same intensity. Many researchers, starting early on (e.g. Holloway et al. (1981) and Brown et al. (1988)) reported that piles in trailing rows of pile groups have significantly less resistance to a lateral load than piles in the lead row, and therefore exhibit greater deflections.
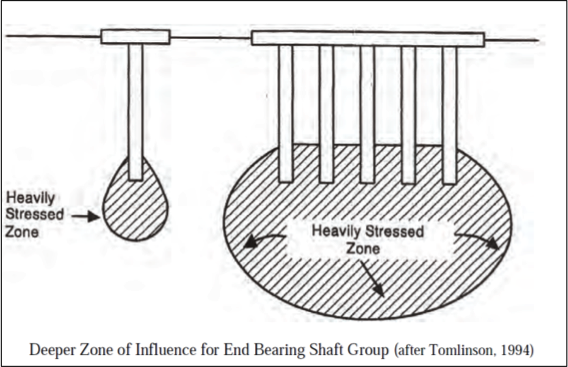 Figure from FHWA (2010) |
Piles in closely spaced groups behave differently than single isolated piles because of pile-soil-pile interactions that takes place in the group. It is generally recognized that deflections of a pile in a closely spaced group are greater than the deflections of an individual pile at the same load because of these interaction effects. The maximum bending moment in a group will also be larger than that for a single pile, because the soil behaves as if it has less resistance, allowing the group to deflect more for the same load per pile.
This unequal distribution of load among piles is caused by “shadowing”, which is a term used to describe the overlap of shear zones and consequent reduction of soil resistance.
Popular methods to account for interaction effects are:
A standard for quantifying group interaction effects is the group efficiency factor, Ge, defined as the average lateral capacity per pile in a group divided by the lateral capacity of a single pile (Prakash 1990).

Model tests and full-scale tests indicate that piles are not influenced by group effects if they are spaced far apart. There is general agreement in the literature that group effects are small when center-to-center pile spacing exceeds 6 pile diameters (6D) in a direction parallel to the load and when they exceed 3D measured in a direction perpendicular to the load.
In order of importance, the factors that influence the group efficiency are:
A standard for quantifying group interaction effects is the “p-multiplier”, an empirical reduction factor for p-y curves, suggested by Brown et al. (1988). This method accounts for the loss of soil resistance, due to both the shadowing effect, and the non-uniform distribution of the resistance within the group. Different values of p-multipliers are assigned to each row of the group.
Brown et al. (1988) proposed the use of a p-multiplier to modify the p-y curve of an individual pile based upon the piles row position. For piles in a given row, the same fm value is applied to all p-y curves along the length of the pile. The lateral capacity of an individual pile in a pile group is a function of its position in the group and the center to center pile spacing.
The procedure follows the same approach used in the p-y analysis, except that a multiplier (fm), with a value less than one, is applied to the soil resistance’ s values of the single pile. This reduces the ultimate soil resistance and softens the shape of the p-y curve.
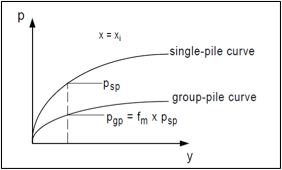
Figure representing the p-multiplier concept for lateral group analysis (after Mokwa, 1999).
1 – Assemble load test data to develop load versus deflection curves for each pile in the group and the single pile.
2 – Develop and adjust single pile p-y curves in order to model the soil conditions at the test site, until a good match is obtained between the calculated and the measured response of the single pile.
3 – Determine fm multipliers values through a trial and error process using the p-y curves developed for the single pile and the measured load versus deflection responses for piles in the group.
In order of importance, the factors that influence p-multipliers are:
The following table presents both the group efficiency factor and the p-multipliers, as two methods to quantify the reduction of capacity of a pile located in a group vs. a single pile. Pile head load deflection relationship is used as an indicator.
Table. Review of group efficiency factors and p-multipliers in the literature| Tests Reference | Soil Type | # of rows in group | Spacing | Group efficiency factor | P-multipliers by row | ||||
| 1 | 2 | 3 | 4 | 5 | |||||
| Meimon et al. (1986) | Clay | 2 | 3d | 0.5 - 0.71 | 0.9 | 0.5 | - | - | - |
| Morrison and Reese (1986) | Sand | 3 | 3d | 0.58 - 0.9 | 0.8 | 0.4 | 0.3 | - | - |
| Brown et al. (1987) | Clay | 3 | 3d | 0.68 - 0.8 | 0.7 | 0.5 | 0.4 | - | - |
| Brown et al. (1988) | Sand | 3 | 3d | 0.63 - 0.7 | 0.8 | 0.4 | 0.3 | - | - |
| Ruesta & Townsend (1997) | Sand | 4 | 3d | 0.6 - 0.91 | 0.8 | 0.7 | 0.3 | 0.3 | - |
| Rollins et al. (1998) | Clay | 3 | 3d | 0.59 - 0.8 | 0.6 | 0.38 | 0.43 | - | - |
| Mokwa (1999) | Sand | 2 | 4d | - | 0.85 | 0.75 | - | - | - |
| Rollins and Sparks (2000) | Silts & Clays | 3 | 3d | - | 0.6 | 0.38 | 0.43 | - | - |
| Cho et al. (2001) | Rock | - | - | 0.59-0.80 | 0.6 | 0.38 | 0.43 | - | - |
| Huang et al. (2001) | Sand | 3 | 3d | 0.92 - 1.02 | 0.93 | 0.7 | 0.74 | - | - |
| Huang et al. (2001) | Sand | 4 | 3d | 0.72 - 0.89 | 0.89 | 0.61 | 0.61 | 0.66 | - |
| Rollins & Sparks (2002) | Silts & Clays | 3 | 3d | - | 0.6 | 0.38 | 0.43 | - | - |
| Snyder et al. (2004) | Clay | 5 | 3.92d | 0.85-0.90 | 1 | 0.81 | 0.59 | 0.71 | 0.59 |
| Rollins et al. (2005) | Sand | 3 | 3.3 d | 0.72 - 0.935 | 0.8 | 0.4 | 0.4 | - | - |
| Rollins et al. (2006) | Clay | 3 | 5.65d | 0.87 - 1.08 | 0.95 | 0.88 | 0.77 | - | - |
| Clay | 4 | 4.4d | 0.75 - 1.0 | 0.9 | 0.8 | 0.69 | 0.73 | - | |
| Clay | 5 | 3.3d | 0.45 - 0.67 | 0.82 | 0.61 | 0.45 | 0.45 | 0.51 | |