|
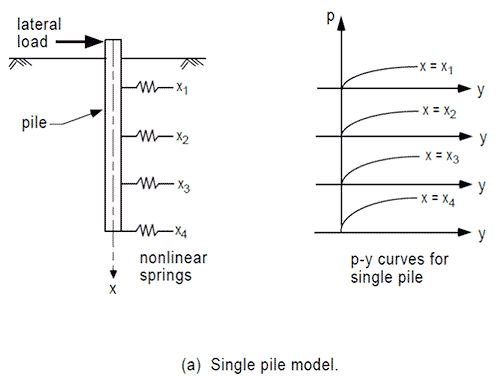
The p-y analysis is a numerical model that simulates the soil resistance as predefined nonlinear springs, where p is the soil pressure per unit length of the pile and y is the pile deflection. The soil is represented by a series of nonlinear p-y curves that vary with depth and soil type.
The p-y curve for a particular point on a foundation depends on many factors, such as:
The influence of these factors is not well established, so it has been necessary to develop p-y curves empirically by back-calculating them from full-scale load tests. |
 FHWA Manual (2010) |
 Interest in the model was first developed in the 1940’s and 1950’s when energy companies build offshore structures that had to sustain heavy horizontal loads from waves. An exact publication date of the model is not available since the p-y curves are still modified and improved today. The earliest recommendations on p-y behavior date back to the 1950 are referring to work of Skempton and Terzaghi (Ruigrok 2010). Some of the early experimental studies started in the 60s and 70s, e.g. Broms (1964), Matlock (1970) and Reese and Cox (1975). Significant progress on the formulation was done in the 1980 and thereafter. The American Petroleum Institute (API) was one of the first agencies to develop design recommendations based on funded research studies for their own offshore construction purposes (e.g. API 1987, 1993, 2005 etc).